Published: January 15, 2025 |Reading Time: 18 minutes |Category: Supply Chain & Operations
Inventory forecasting in leather bag manufacturing is the systematic process of predicting future demand for leather goods and raw materials to optimize production schedules, minimize carrying costs, and maintain target service levels. It encompasses demand planning methodologies, safety stock calculations, seasonal trend analysis, and material procurement strategies tailored to the unique characteristics of the leather goods supply chain.
According to the State of Supply Chain Report 2024 by McKinsey & Company, manufacturers implementing advanced demand forecasting reduce inventory carrying costs by an average of 22% while improving order fulfillment rates by 15-18%.
For leather bag manufacturers, inventory forecasting is not merely a logistical exercise—it is the strategic backbone that determines whether a production facility thrives or struggles in an increasingly competitive global marketplace. The leather goods industry operates on long lead times, seasonal demand cycles, and raw material constraints that make accurate forecasting both more challenging and more valuable than in most other manufacturing sectors.
At Bespoke Bags (Junyuan Bags), our 20+ years of experience serving 200+ brands across 100+ countries has given us deep insight into the forecasting challenges that leather bag manufacturers face daily. From our 4,950 m² SGS-verified production floor in Quanzhou, we have developed inventory management practices that balance the competing demands of cost efficiency, customer satisfaction, and production flexibility.
This guide distills those insights into an actionable framework for demand planning and stock optimization in leather bag manufacturing.
Why Leather Bag Inventory Forecasting Differs from General Manufacturing

The leather goods industry possesses several structural characteristics that make inventory forecasting uniquely complex compared to general consumer product manufacturing. Understanding these differences is the first step toward building a forecasting system that actually works.
Extended and Variable Lead Times
Leather itself—a primary raw material—requires 30-60 days for tanning and finishing, depending on the type and quality grade. When you add hardware sourcing, component manufacturing, cutting, stitching, assembly, and quality control, the total production cycle for a leather bag typically spans 45-90 days. This is substantially longer than textile or synthetic goods manufacturing.
According to the Global Leather Industry Report 2024 published by the Food and Agriculture Organization (FAO), international leather supply chains face average transit times of 25-40 days for raw hides and 15-30 days for finished leather components. These lead times introduce forecasting windows that require manufacturers to predict demand three to six months in advance.
Raw Material Constraints and Quality Variability
Unlike synthetic materials that can be produced on demand, genuine leather depends on hide availability, which is itself tied to livestock cycles, seasonal slaughtering patterns, and environmental regulations on tanning operations. The Leather Working Group (LWG) reports that certified tanneries represent approximately 38% of global tanning capacity, creating supply bottlenecks during peak demand periods.
Additionally, leather is a natural material with inherent variability. Hide quality, color consistency, and texture can vary between batches, meaning manufacturers cannot simply reorder identical materials without quality verification. This natural variability must be incorporated into forecasting models through appropriate safety margins.
Seasonal Demand Concentration
The leather goods market exhibits pronounced seasonality. According to data from the U.S. Bureau of the Census and European retail trade associations, approximately 35-42% of annual leather bag sales occur during Q4 (October through December), driven by holiday gift-giving. A secondary peak occurs in late Q1 and early Q2, corresponding to spring fashion transitions and graduation gift-giving seasons.
This concentration means that forecasting errors during peak planning windows carry outsized financial consequences. Over-forecasting Q4 leads to significant post-holiday markdowns, while under-forecasting results in lost revenue that cannot be recovered due to the long production cycles described above.
Core Demand Forecasting Methods for Leather Goods
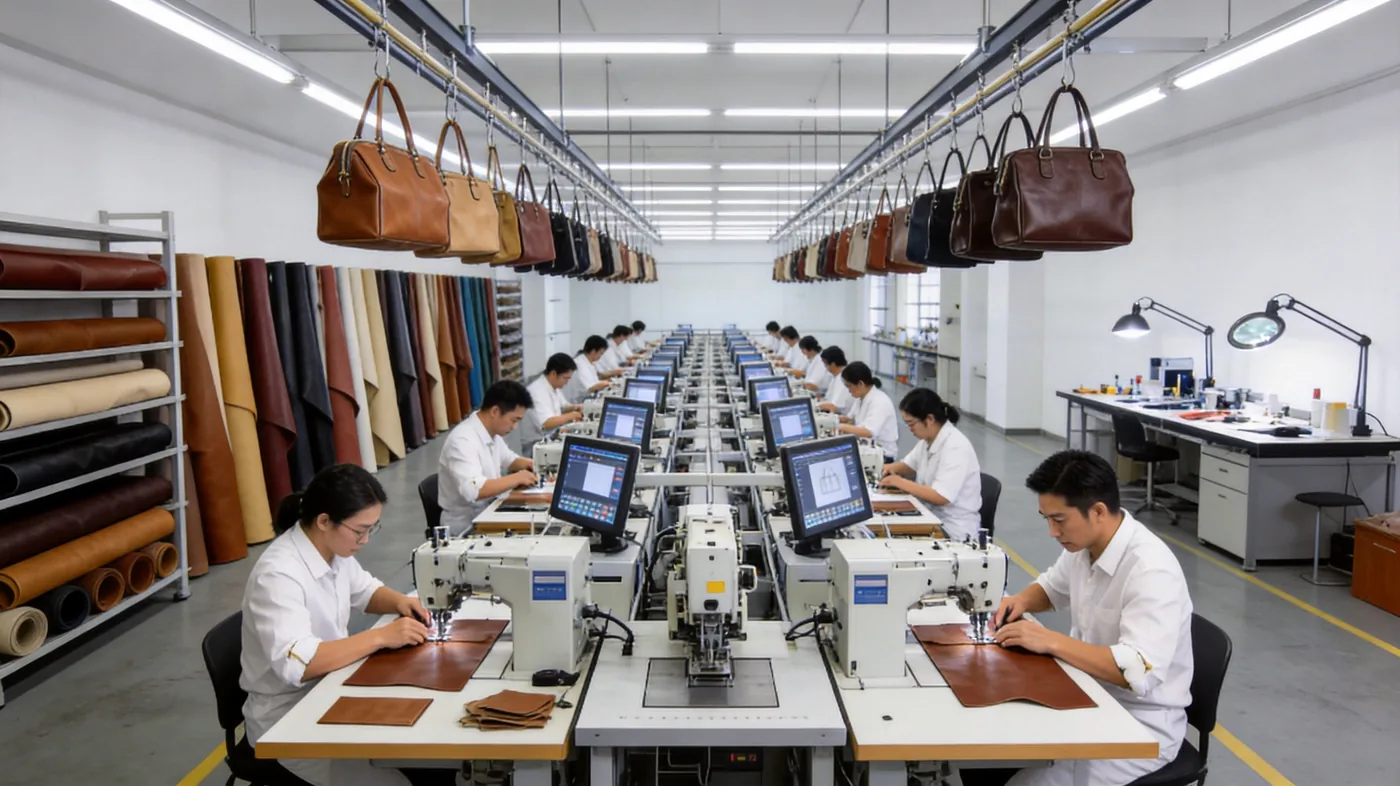
Effective demand forecasting in leather bag manufacturing requires a multi-method approach. No single technique captures all the dimensions of demand in this industry. The most successful manufacturers blend quantitative analysis with qualitative market intelligence.
Time-Series Analysis and Moving Averages
For established product lines with historical sales data, time-series methods provide the quantitative foundation for forecasting. The three most applicable techniques for leather bag manufacturers are:
- Simple Moving Average (SMA): Best for stable, mature product lines where recent demand patterns are representative of future trends. A 3-month SMA smooths out monthly fluctuations while remaining responsive to trend shifts.
- Weighted Moving Average (WMA): Assigns greater importance to recent months, making it suitable for products experiencing gradual trend shifts—such as a classic tote bag gaining popularity through social media exposure.
- Exponential Smoothing (Holt-Winters): Captures both trend and seasonality simultaneously. This is particularly valuable for leather bags, where seasonal patterns repeat annually but with year-over-year growth or decline trends.
Research published in the International Journal of Production Economics (2023) demonstrates that Holt-Winters exponential smoothing achieves a Mean Absolute Percentage Error (MAPE) of 12-18% for seasonal consumer goods with established demand histories—making it the most reliable single-method approach for leather goods.
Causal and Regression-Based Forecasting
When external factors significantly drive demand, causal models outperform pure time-series methods. For leather bags, the most impactful causal variables include:
- Consumer confidence indices — luxury and premium leather goods are discretionary purchases highly correlated with economic sentiment
- Fashion industry trend indicators — runway show analysis, trade show attendance data, and social media engagement metrics
- Retailer order patterns — wholesale order volumes from key accounts serve as leading indicators
- Competitor pricing actions — price changes by major brands in adjacent segments shift demand elasticity
Qualitative Methods: The Human Intelligence Layer
In leather goods manufacturing, qualitative forecasting methods are not a nice-to-have—they are essential. The custom design process inherently involves customer-specific demand projections that no algorithm can generate independently.
Key qualitative methods include:
- Sales force composite: Aggregating demand signals from your sales team across different markets and customer segments
- Customer commitment analysis: Using confirmed purchase orders, deposit levels, and customer communication intensity as leading demand indicators
- Trade show intelligence: Linea Pelle (Bologna), Mipel (Milan), and APLF (Hong Kong) provide 6-12 month advance signals about market direction
- Delphi method: Structured expert panels combining design, production, and commercial perspectives to arrive at consensus forecasts
Industry Insight: According to McKinsey's The State of Fashion 2024 report, brands that integrate AI-powered demand sensing with traditional forecasting methods achieve a 23% reduction in forecast error compared to those relying solely on historical data analysis.
Seasonal Demand Patterns in the Leather Goods Market
Understanding and quantifying seasonality is critical for leather bag inventory optimization. The seasonal patterns vary by product category, market geography, and price segment.
Several key insights emerge from this seasonal analysis:
- Luxury handbags show the strongest Q4 surge (index 120-145), driven by holiday gifting. Production preparation for these items must begin no later than June.
- Business bags peak in January-February, aligned with the new business year and corporate gifting cycles. Material procurement should start by August-September.
- Small leather accessories (wallets, cardholders, key fobs) exhibit the most extreme December spike (index 150), as these items are popular stock fillers and impulse gifts. Their short production times allow for more responsive replenishment.
- Casual and travel bags peak in summer months, requiring production starts in February-March.
Safety Stock Calculation for Leather Bag Production

Safety stock serves as the buffer against the inherent uncertainty in both demand and supply. For leather bag manufacturers, calculating appropriate safety stock levels is particularly important due to the high value of raw materials and finished goods.
The Safety Stock Formula
The standard safety stock calculation uses the following formula:
SS = Z × √(LT × σd² + d² × σLT²)
Where:
- Z = Service level factor (1.28 for 90%, 1.65 for 95%, 1.96 for 97.5%, 2.33 for 99%)
- LT = Average lead time (in days or weeks)
- σd = Standard deviation of demand during lead time
- d = Average daily demand
- σLT = Standard deviation of lead time
Service Level Trade-offs
The choice of target service level is fundamentally a business decision that balances inventory investment against stockout risk. For premium leather products where stockouts mean lost wholesale relationships and damaged brand reputation, higher service levels (95-97.5%) are typically justified. The cost of carrying additional leather inventory—while significant—is usually far less than the cost of a stockout during a key selling season.
However, manufacturers should regularly review whether actual demand variability justifies their chosen service levels. If a product's demand coefficient of variation (CV = σ/μ) drops below 0.2, the safety stock requirement decreases substantially, freeing working capital for other uses.
Material Pre-Ordering Strategies
Given the extended lead times in leather sourcing, material pre-ordering strategies form the tactical foundation of effective inventory management in this industry.
Strategic Raw Material Reserves
Forward-thinking leather bag manufacturers maintain strategic reserves of their most commonly used leathers and hardware. This approach decouples raw material availability from specific order forecasts, enabling faster response to unexpected demand.
Key strategies include:
- Blanket orders with tanneries: Negotiating annual volume commitments in exchange for preferential pricing and priority production slots. This is particularly valuable for full-grain and top-grain leathers where tannery capacity can become constrained during peak seasons.
- Semi-finished inventory: Maintaining cut pieces, pre-stitched panels, and pre-assembled components in various standard sizes and colors. This approach—common in small-batch manufacturing environments—reduces total lead time by 15-25 days for reorder quantities.
- Hardware standardization: Reducing the variety of zippers, buckles, and fittings across product lines enables bulk purchasing and reduces the number of SKUs that require individual safety stock calculations.
Lead Time Management
Reducing and stabilizing lead times has a direct, multiplicative effect on forecast accuracy and safety stock requirements. The relationship is captured in the safety stock formula: as lead time variability (σLT) decreases, required safety stock decreases proportionally.
Practical lead time reduction strategies for leather bag manufacturers:
- Supplier diversification: Maintain relationships with multiple tanneries and hardware suppliers to avoid single-source bottlenecks. The COVID-19 pandemic demonstrated that single-source dependencies carry unacceptable risk.
- Local sourcing for time-critical items: For rush orders or replenishment quantities, local or regional suppliers may cost more per unit but reduce lead time variability dramatically.
- Production scheduling buffers: Building realistic buffers into production schedules—rather than optimistic estimates—improves delivery reliability and enables more accurate customer communication.
- Quality at source programs: Working with suppliers to implement incoming quality standards reduces rejection rates and the associated re-procurement lead times.
Pro Tip: Our experience at Junyuan Bags shows that implementing a structured vendor rating system—evaluating suppliers quarterly on delivery performance, quality consistency, and communication responsiveness—improved our on-time material receipt rate from 78% to 94% within 18 months. This directly reduced the safety stock we needed to carry.
Balancing Inventory Costs with Service Levels
The fundamental tension in inventory management is the trade-off between carrying costs and service level targets. Understanding this trade-off quantitatively enables better decision-making.
Inventory Carrying Cost Breakdown
For leather bag manufacturers, typical annual carrying costs range from 22-32% of average inventory value, broken down as follows:
- Capital cost: 8-12% (cost of capital tied up in inventory)
- Storage and warehousing: 4-6% (rent, utilities, handling equipment)
- Insurance and taxes: 1-3%
- Obsolescence and deterioration: 3-5% (particularly relevant for leather—color fading, moisture damage, style changes)
- Shrinkage and damage: 1-2%
For a manufacturer holding $2 million in average inventory, annual carrying costs of 25% translate to $500,000 in inventory-related expenses. A 15% reduction in inventory levels—achievable through better forecasting—saves $75,000 annually without impacting service levels.
The Cost of Stockouts
Stockout costs in leather bag manufacturing often dramatically exceed carrying costs. These include:
- Lost sales revenue (immediate)
- Expedited shipping costs for emergency replenishment
- Production inefficiency from short runs and changeovers
- Customer relationship damage and potential loss of future orders
- Brand reputation erosion, particularly for retail partners who plan shelf allocations
The optimal inventory policy finds the point where the marginal cost of carrying additional inventory equals the marginal cost of expected stockouts. In practice, most successful leather bag manufacturers target service levels between 93-97%, adjusting upward for high-margin products and key accounts, and downward for low-margin items with predictable demand.
Tools and Software for Leather Bag Inventory Forecasting
The technology landscape for inventory forecasting offers solutions across the entire scale spectrum. Selecting the right tool depends on production volume, product complexity, and organizational maturity.
Enterprise Resource Planning (ERP) Systems
For mid-to-large leather bag manufacturers, integrated ERP systems provide the most comprehensive forecasting capabilities. Leading options include:
- SAP Business One / S/4HANA: Industry-leading demand planning modules with advanced statistical forecasting, suitable for manufacturers with multiple product lines and international operations.
- Microsoft Dynamics 365: Strong integration with Microsoft's AI and analytics ecosystem, offering Copilot-powered demand sensing capabilities.
- Oracle NetSuite: Particularly well-suited for mid-market manufacturers, offering cloud-native demand planning with real-time visibility across the supply chain.
Specialized Demand Planning Software
For manufacturers seeking best-of-breed forecasting capabilities:
- Blue Yonder (formerly JDA): Advanced machine learning-based demand sensing, particularly strong for seasonal industries.
- Kinaxis RapidResponse: Concurrent planning across demand, supply, and production—ideal for complex leather goods operations.
- o9 Solutions: AI-powered platform with strong capabilities in managing complex BOM (Bill of Materials) structures common in leather goods.
Accessible Solutions for Small and Mid-Size Manufacturers
Not every leather bag manufacturer needs an enterprise system. Practical alternatives include:
- Zoho Inventory / Zoho PLM: Affordable, cloud-based inventory management with basic forecasting capabilities.
- TradeGecko (now QuickBooks Commerce): Multi-channel inventory management suitable for brands selling through both wholesale and direct channels.
- Advanced Excel modeling: For manufacturers with fewer than 500 SKUs, well-structured spreadsheet models using Solver and statistical add-ins can deliver surprisingly effective forecasting results.
Building a Forecasting Process: Step-by-Step Implementation
For manufacturers transitioning from reactive inventory management to systematic forecasting, we recommend the following phased implementation approach:
Phase 1: Foundation (Months 1-3)
- Audit existing inventory data for accuracy and completeness
- Classify products using ABC analysis (A = top 20% by revenue, B = next 30%, C = remaining 50%)
- Establish baseline service levels and calculate current forecast accuracy (MAPE)
- Document current lead times for all critical materials and processes
Phase 2: Method Implementation (Months 4-6)
- Select forecasting methods appropriate to each product category
- Build seasonal indices based on historical data
- Calculate and implement safety stock levels by SKU
- Establish reorder points and economic order quantities
Phase 3: Optimization (Months 7-12)
- Implement rolling forecast updates (monthly or bi-weekly)
- Integrate qualitative inputs from sales and design teams
- Begin tracking forecast accuracy as a KPI and conducting monthly forecast review meetings
- Explore technology investments based on identified gaps
Phase 4: Advanced Capabilities (Year 2+)
- Implement demand sensing using real-time point-of-sale data from retail partners
- Deploy machine learning models for high-volume SKUs
- Integrate forecasting with OEM/ODM production planning systems for end-to-end optimization
- Collaborative planning with key customers using Vendor Managed Inventory (VMI) models
Key Performance Indicators for Inventory Forecasting
Measurement drives improvement. The following KPIs should be tracked monthly to ensure your forecasting system remains effective:
- Forecast Accuracy (1 - MAPE): Target >80% for A-items, >70% for B-items, >60% for C-items
- Bias (Forecast vs. Actual): Should trend toward zero over time; persistent positive or negative bias indicates systematic over- or under-forecasting
- Inventory Turnover Ratio: Target 4-6x annually for leather goods (higher for accessories, lower for luxury items)
- Service Level (Order Fill Rate): Target >95% for key accounts, >90% overall
- Days of Inventory Outstanding (DIO): Track trend over time; target 60-90 days for finished goods, 30-45 days for raw materials
- Stockout Frequency and Duration: Track incidents by SKU and root cause
Conclusion: Forecasting as a Competitive Advantage
In the leather bag manufacturing industry, where long lead times, seasonal demand concentration, and material variability create inherent supply chain complexity, effective inventory forecasting is not merely an operational necessity—it is a genuine competitive advantage. Manufacturers who forecast well produce more reliably, carry less excess inventory, and serve their customers more consistently.
At Bespoke Bags, we have invested two decades in refining these forecasting and inventory management practices. Our experience producing for 200+ brands across 100+ countries has given us the data, the tools, and the expertise to maintain optimal inventory levels while delivering on tight timelines. Whether you need private label leather bags or fully custom collections, our production planning ensures your inventory needs are met with precision.
Forecasting a New Style When No History Exists
Statistical methods need a past, and a new style does not have one. This is the situation most leather programmes face twice a year, and the answer is not to guess more confidently — it is to substitute borrowed evidence for missing evidence and then buy real data as cheaply as possible.
- Name the closest analogue. Identify the existing style nearest in price, size and use, and start from its first-season curve rather than from its matured rate.
- Adjust for the differences, in writing. A higher price usually means a slower start; a new colourway usually cannibalises the core before it adds volume.
- Use a pilot run as a measurement tool. A small first quantity converts an assumption into a sell-through rate before the full commitment.
- Collect leading signals early: waitlist sign-ups, pre-orders, add-to-basket rates and wholesale sample feedback all move before sales do.
- Set a review date at launch, not at season end — the fourth week of real data is worth more than another month of modelling.
| Missing input | Substitute | Confidence to assign |
|---|---|---|
| Sell-through rate | First-season curve of the closest analogue | Medium |
| Weekly demand shape | Category-level shape from comparable styles | Medium to high |
| Return rate | Category average for the price band | High |
| Colour split | Previous season split, adjusted for the new shade's role | Low to medium |
| Absolute volume | Pilot run result, then extrapolated | Low at first, rising quickly |
The discipline is to mark each substituted figure with its confidence, and to revisit the low-confidence ones first. A forecast that states where it is weak is far more useful than one that presents every number with the same apparent certainty.
Running a Rolling Forecast: Cadence, Ownership and Governance
A forecast produced once a year is a document; a forecast revisited monthly is a management tool. Rolling review works because it shortens the distance between a change in demand and a change in the plan — which, over a production pipeline measured in months, is worth more than any improvement in the underlying model.
| Step | Owner | Output |
|---|---|---|
| Close last month's actuals | Operations | Corrected sales, returns and stock position by SKU |
| Refresh the statistical base | Planning | Updated baseline for the next three to six months |
| Layer commercial intelligence | Sales and marketing | Promotions, launches, channel changes |
| Reconcile with capacity | Programme coordination | Booking windows and material lead times confirmed |
| Publish one agreed number | Business owner | A single forecast everyone plans against |
- One number, one owner. Parallel forecasts in sales and operations guarantee that someone is planning against a figure nobody agreed.
- Freeze a near-term window. Changes inside the production pipeline should require explicit approval, because they cost real money.
- Log every override with a reason, so forecast accuracy can be judged against the model rather than against the edited version.
- Keep the horizon long enough to cover sampling plus bulk production plus freight — around six months for most programmes.
Reconciling the Forecast With What Production Can Absorb
A forecast is only executable if it fits the shape of the production calendar. Demand curves are smooth; production is booked in discrete windows with minimum quantities and fixed intervals. Reconciling the two is where a good forecast either becomes a shipped order or becomes a missed season.
- Convert the forecast into booking windows rather than into monthly unit targets.
- Round to the minimum. A forecast of 620 units is an order of 500 plus a decision about the remainder.
- Group styles that share materials so one booking covers several SKUs and setup time is not duplicated.
- Reserve earlier than feels necessary. Capacity booked six weeks ahead is cheap; capacity requested in the week it is needed is not available.
Teams that reconcile monthly rather than seasonally consistently hold less excess stock, not because their forecasts are cleverer but because their orders fit the calendar. In a pipeline this long, timing is most of the accuracy.
Frequently Asked Questions
What is the most accurate demand forecasting method for leather bag manufacturing?
A hybrid approach combining time-series analysis with qualitative market intelligence delivers the highest accuracy for leather bag manufacturing. Manufacturers should blend historical sales data regression with trend analysis from fashion industry reports, trade show insights, and retailer feedback. According to Gartner Supply Chain research, companies using combined forecasting methods achieve 15-20% better forecast accuracy than those relying on a single method.
How much safety stock should leather bag manufacturers maintain?
Leather bag manufacturers should typically maintain safety stock equivalent to 20-30% of average monthly demand for finished goods, and 45-60 days of raw material coverage for critical leathers and hardware. The exact level depends on lead time variability, demand volatility, and service level targets. Using the standard safety stock formula: SS = Z × σ × √LT, where Z is the service factor (1.65 for 95% service level), σ is demand standard deviation, and LT is lead time in consistent units.
What are the peak seasons for leather bag manufacturing and sales?
The leather goods industry experiences two primary peak seasons: Q3-Q4 for holiday gift-giving (accounting for 35-40% of annual retail sales) and late Q1 for spring/summer collections. According to the Leather Working Group and industry trade data, manufacturers should begin production preparation 4-6 months ahead of these peaks, meaning material procurement starts as early as January for holiday season inventory.
How can small-batch leather bag manufacturers optimize inventory costs?
Small-batch manufacturers with MOQs of 500 pieces can optimize inventory by implementing just-in-time principles for standard materials, negotiating blanket purchase orders with tanneries for volume discounts without immediate delivery, maintaining modular inventory of semi-finished components, and using demand-driven pull systems rather than push forecasting. Partnering with flexible OEM manufacturers who support small-batch production also reduces the need for large safety stock holdings.
What software tools are best for leather bag inventory forecasting?
The most effective inventory forecasting tools for leather bag manufacturers include ERP systems like SAP Business One and Microsoft Dynamics 365 for comprehensive supply chain management, specialized demand planning software such as Blue Yonder and Kinaxis for advanced analytics, and accessible options like NetSuite and Zoho Inventory for small to mid-sized operations. The choice depends on production scale, budget, and integration requirements with existing systems.
Last Updated: August 14, 2026
How do you forecast a leather bag style that has no sales history?
Borrow evidence: start from the first-season curve of the closest analogue style, adjust in writing for price and colour differences, and add leading signals such as waitlists and add-to-basket rates. Then buy real data cheaply through a pilot run and review in week four.
How often should a leather bag forecast be updated?
Monthly is the practical standard. Refresh the statistical base, layer commercial intelligence, reconcile against production capacity, and publish one agreed number. Freeze a near-term window so changes inside the production pipeline require explicit approval rather than informal edits.
Who should own the forecast in a small organisation?
One named owner, reviewing inputs from operations, sales and programme coordination. Multiple parallel forecasts guarantee that someone plans against an unagreed figure. The owner's job is to publish a single number each month and to log every override with a reason.
What forecast horizon is long enough for leather bag production?
At least six months. That covers sampling at 6–10 working days, bulk production at 35–50 days after approval, and sea freight from Xiamen, with room to reserve materials and capacity. Anything shorter forces emergency decisions inside an already booked pipeline.
How should a fractional forecast quantity be handled?
Round down to the standard 500-piece minimum per style and colourway and treat the remainder as an explicit decision: hold, add to the next booking, or cover with a small-batch run. Silently rounding up converts a planning assumption into unsold stock.
Why does an accurate forecast still result in a stockout?
Usually because the order was placed after the booking window closed, or because a specification change turned a reorder into a redevelopment. Timing, not arithmetic, causes most stockouts in long-lead leather programmes.
How does production capacity affect what can be forecast?
Capacity is booked in windows, so convert the forecast into bookings rather than monthly targets. Group styles sharing materials into one booking, and reserve six weeks or more ahead. A forecast that ignores the calendar is a wish list regardless of its accuracy.